
Data Visualization & Reporting
Data Visualization Consultant for Clear, Useful Dashboards
Dynamic Data turns messy numbers into dashboards your team will actually use. Tell us what you need to see and we will scope the work.
- Custom dashboards built around the KPIs you care about
- Data from many sources pulled into one clear view
- 40+ data pros across the USA, Europe and South America
Top Rated Plus on Upwork. Trusted by Pima Solar, Zenus and Rob Ramsdell.
Get your data visualization quote
Tell us what you need to see. A consultant will review your request and reply by email.
Why teams hire our data visualization consultants
Dashboards people use
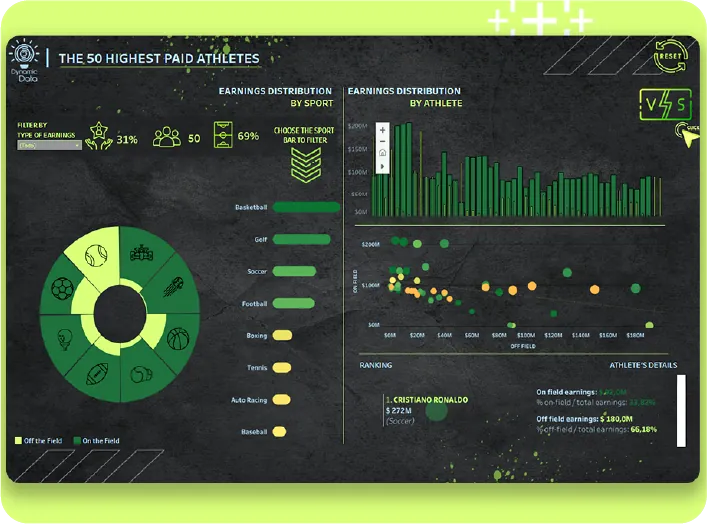
We design interactive dashboards and reports that let you drill into the numbers and find the answer fast.
One clear source of truth
We connect and consolidate data from separate systems, so your team stops arguing about whose number is right.
See today's numbers
Real-time reporting pipelines keep your dashboards current, so you act on what is happening now.
Built for your business
We build custom visualization tools around your context and KPIs, not a template someone else used.
A full data team
Over 40 professionals across the USA, Europe and South America, with skills in 35+ platforms and languages.
Clear stories, not just charts
We use visuals to explain what the data means, so non-technical stakeholders can follow and decide.
What our data visualization consulting covers
Dynamic Data is a data consultancy founded in 2020 and based in Carlsbad, California. We deliver project-based consulting and implementation, from the pipelines that feed your reports to the dashboards leaders open every morning.
Every engagement is shaped around your goals. Some clients need one executive dashboard. Others need the data engineering behind it fixed first. We scope both on a call before any work starts.
- Interactive dashboards and reports with drill-down into the detail
- Custom visualization tools designed for your business context
- Real-time reporting so teams act on the latest data
- Executive-level reporting and KPI tracking
- Storytelling with data for non-technical audiences
- Data exploration and mining to surface patterns and trends
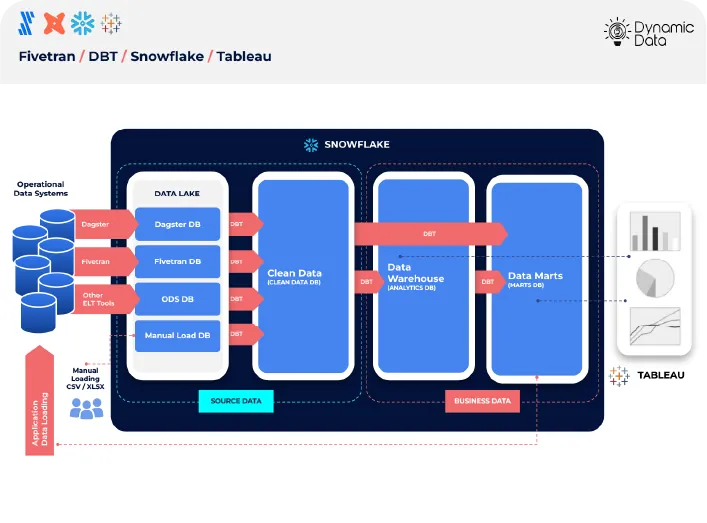
- Data integration and pipeline work to feed clean data into your reports
- dbt analytics engineering by a dbt Certified Developer
Companies that trust Dynamic Data
“Collaborating with Dynamic Data was a critical component of building my business. They are dedicated to understanding my needs and are able to transform complex data into simple and useful data visualizations that help both my team and my clients. Dynamic Data are great partners, enhance my brand, and have been a key part of the growth of my business.”
“The dashboards delivered by the Dynamic Data team exceeded my expectations. I was able to get clarity on data I didn't even realize I could get.”
“Victoria and her team were EXCELLENT - i cannot talk highly of them enough. They helped me create a world class product. Their organization and strategy and delivery was all timely and as expected. you will not be disappointed! Choose them.”
What happens after you send the form
Tell us what you need
Share your goals, your data sources and the decisions you want the dashboards to support.
Scoping call
A consultant reviews your setup, maps the KPIs and tools, and comes back with a plan and a quote.
We build and refine
Our team builds the dashboards or visualization tools, reviews them with you, and adjusts until they fit.
Frequently asked questions
How much does data visualization consulting cost?
Pricing depends on the scope: how many data sources, how many dashboards and how much data work is needed first. We quote after a short scoping call so the number matches your project.
Do you sell BI software licenses?
No. Dynamic Data is a consultancy. We provide strategy, implementation and build services. We do not resell off-the-shelf BI or analytics software licenses or hardware.
What if our data is messy or spread across systems?
That is common. We also do data engineering and integration: pipelines, automation, and consolidating data from separate sources so your dashboards sit on accurate, consistent data.
Do you work with companies outside California?
Yes. We are headquartered in Carlsbad, California and serve clients in the United States, with delivery teams across Europe, South America and the USA.
Can you build a visualization tool for our own product or clients?
Yes. We design custom visualization tools and interactive dashboards tailored to your business context and audience.
Do you offer training courses on data visualization?
We do not sell training courses or certifications. We deliver consulting and build projects, and we walk your team through the dashboards we deliver.
Ready to see your data clearly?
Tell us what you need to track and who needs to see it. A Dynamic Data consultant will review your request and come back with next steps and a quote.
- Custom dashboards built around the KPIs you care about
- Data from many sources pulled into one clear view
- 40+ data pros across the USA, Europe and South America